Analyze Trends Over Time with Binned Years (Decades)
Source:R/analyze_trends_over_time.R
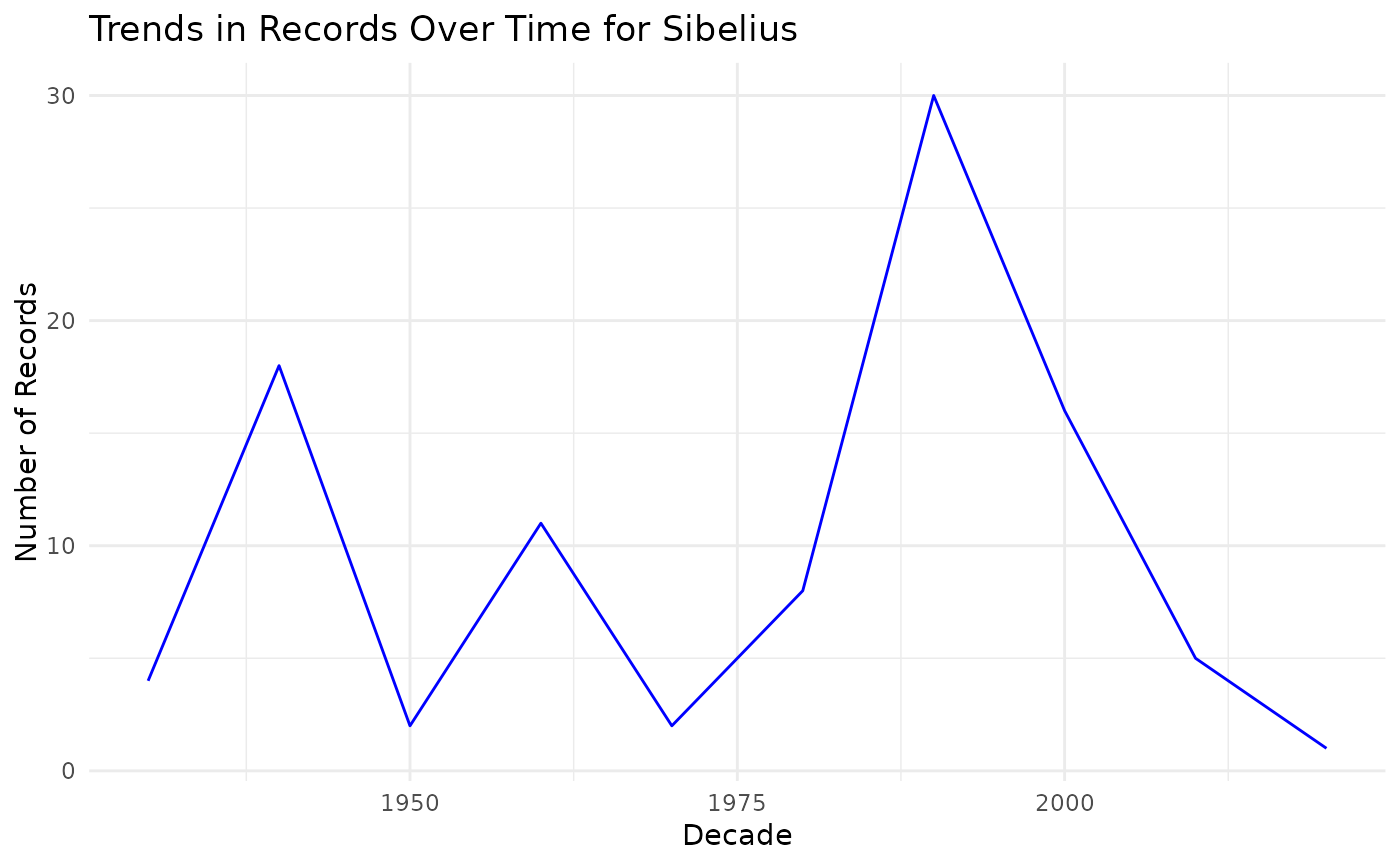
analyze_trends_over_time.RdThis function analyzes how search results for a given query have trended over time, binned by decades. It plots the number of records found for each decade, allowing users to observe long-term trends.
Examples
finna_data <- search_finna("Sibelius")
#> Warning: Default limit of 100 records is being used. Specify 'limit' argument for more records.
#> Total results found: 44532
#> Data fetching completed in 0.65 seconds.
trends <- analyze_trends_over_time(finna_data, "Sibelius")
print(trends)