Introduction
The purpose of the refine_metadata() function is to:
- Ensure completeness by filling in missing values with placeholder text.
- Standardize key metadata fields for easier analysis.
- Select only the most relevant fields, simplifying the dataset.
This refinement process makes the metadata more consistent and user-friendly, reducing potential issues in subsequent analysis or reporting.
library(finna)
library(ggplot2)
sibelius_data <- search_finna("sibelius")
refined_data <- refine_metadata(sibelius_data)
print(refined_data)
## # A tibble: 100 × 8
## Title Author Year Language Formats Subjects Library Series
## <chr> <chr> <chr> <chr> <chr> <chr> <chr> <chr>
## 1 Sibelius favourites : … Sibel… 2001 Unknown… Äänite… orkeste… Lapin … Unkno…
## 2 Sibelius Tawas… 1997 fin Kirja,… Sibeliu… Eepos-… Unkno…
## 3 Sibelius Tawas… 1997 fin Kirja,… Sibeliu… Kansal… Unkno…
## 4 Sibelius Downe… 1945 fin Kirja,… Sibeliu… Heili-… Unkno…
## 5 Sibelius Downe… 1945 fin Kirja,… Sibeliu… OUTI-k… Unkno…
## 6 Sibelius Tawas… 1968 swe Kirja,… Sibeliu… Anders… Unkno…
## 7 SIBELIUS RINGB… 1948 swe Kirja,… SIBELIU… Helle-… Unkno…
## 8 SIBELIUS TAWAS… 1968 swe Kirja,… SIBELIU… Helle-… Unkno…
## 9 Sibelius Gray,… 1945 eng Kirja,… Sibeliu… Vanamo… Unkno…
## 10 Sibelius Picke… 1960 spa Kirja,… Sibeliu… Jyväsk… Unkno…
## # ℹ 90 more rows
Analyze using analyze_metadata()
Function
sibelius_data <- search_finna("sibelius")
refined_data <- refine_metadata(sibelius_data)
analysis_results <- analyze_metadata(refined_data)
print(analysis_results)
## $format_distribution
## # A tibble: 9 × 2
## Formats n
## <chr> <int>
## 1 Kirja, Kirja 52
## 2 Lehti/Artikkeli, Artikkeli 20
## 3 Äänite, CD 12
## 4 Äänite, Äänilevy 6
## 5 Video, DVD 5
## 6 Video, Elokuva, lyhyt 2
## 7 Arkisto/Kokoelma, Arkistosarja 1
## 8 Video, Elokuva, pitkä 1
## 9 Äänite, Äänikasetti 1
##
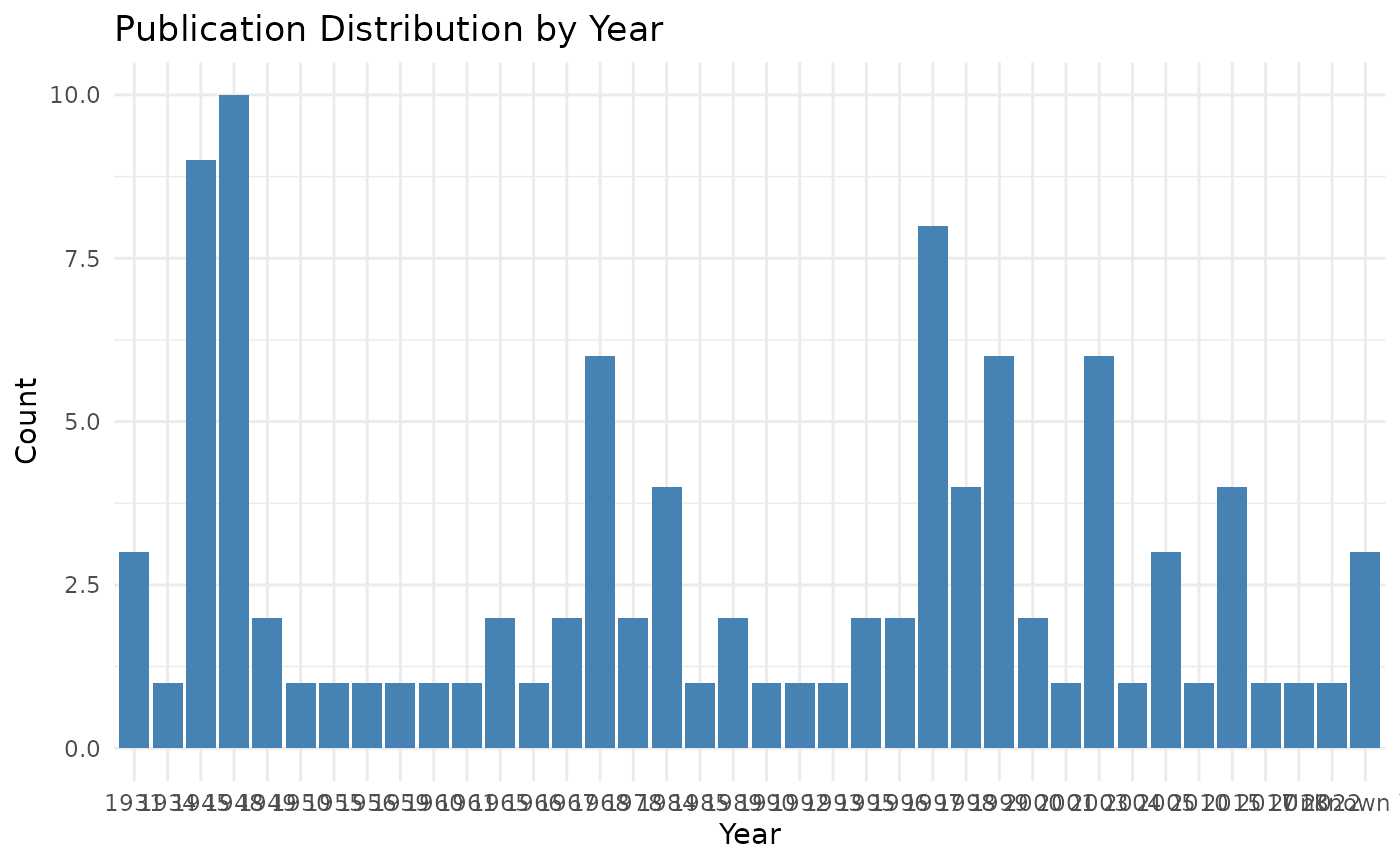
## $year_distribution
## # A tibble: 37 × 2
## Year n
## <chr> <int>
## 1 1997 9
## 2 1948 8
## 3 1999 8
## 4 1945 6
## 5 1968 6
## 6 2003 6
## 7 1998 5
## 8 1949 4
## 9 1996 4
## 10 1931 3
## # ℹ 27 more rows
##
## $author_distribution
## # A tibble: 49 × 2
## Author n
## <chr> <int>
## 1 Häyrynen, Antti 13
## 2 Sibelius, Jean 10
## 3 Layton, Robert 6
## 4 Ringbom, Nils-Eric 5
## 5 Gray, Cecil 4
## 6 Lampila, Hannu-Ilari 4
## 7 Haapaniemi, Jaakko 3
## 8 Schouwman, Hans 3
## 9 Tawaststjerna, Erik 3
## 10 Valsta, Heikki 3
## # ℹ 39 more rows1. Applying the visualize_year_distribution()
Function
sibelius_data <- search_finna("sibelius")
refined_data <- refine_metadata(sibelius_data)
analysis_results <- analyze_metadata(refined_data)
#visualize_year_distribution(analysis_results$year_distribution)
top_plot(analysis_results$author_distribution, field = "n") +
    xlab("Frequency") +  # Custom X-axis label
    ylab("Number of Authors")  # Custom Y-axis label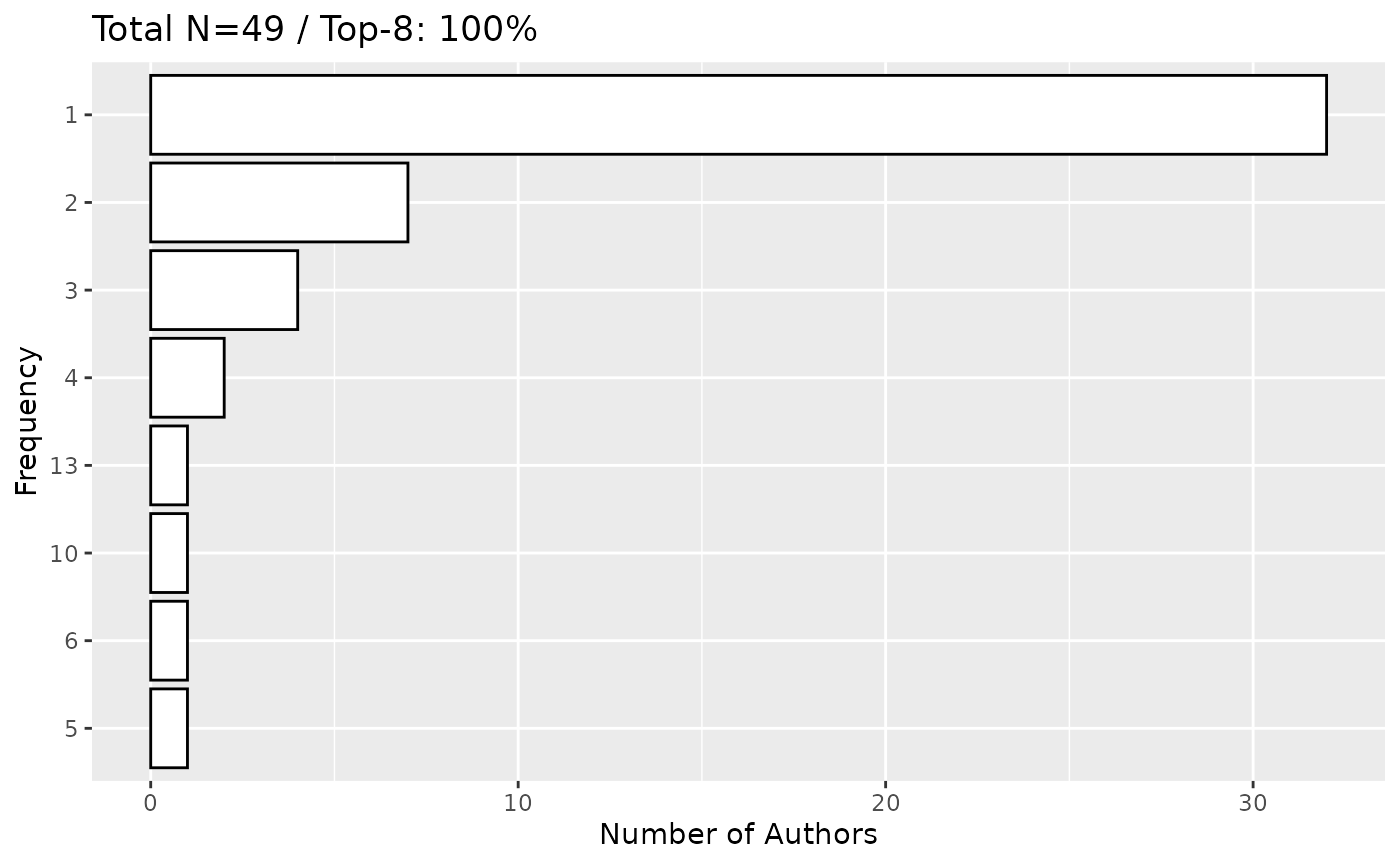
1. yearly distribution using top_plot()
library(finna)
sibelius_data <- search_finna("sibelius")
refined_data <- refine_metadata(sibelius_data)
#visualize_year_distribution_line(refined_data)
top_plot(refined_data, field = "Year") +
  xlab("Publication Year") +  # Custom X-axis label
  ylab("Number of Publications")  # Custom Y-axis label