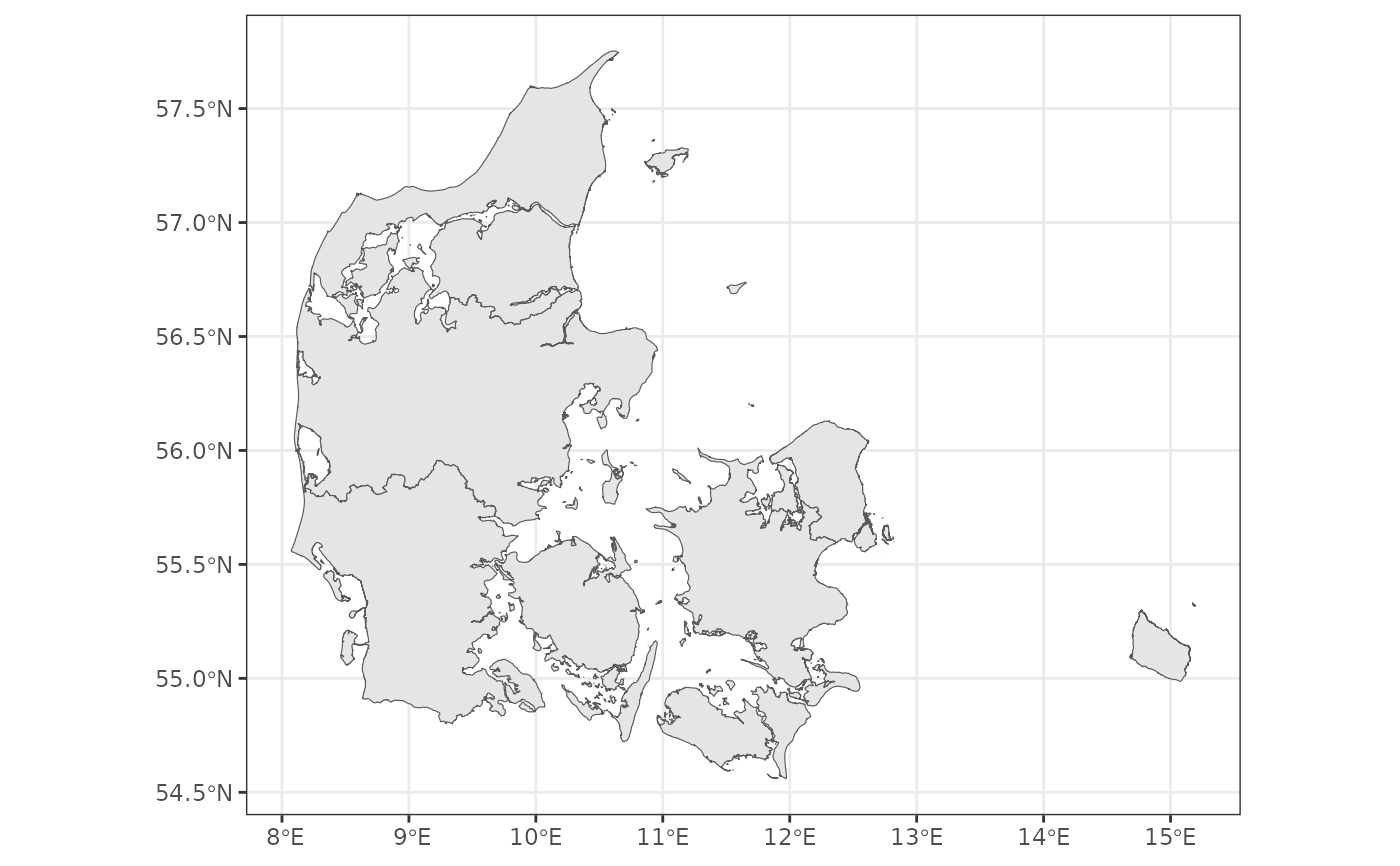
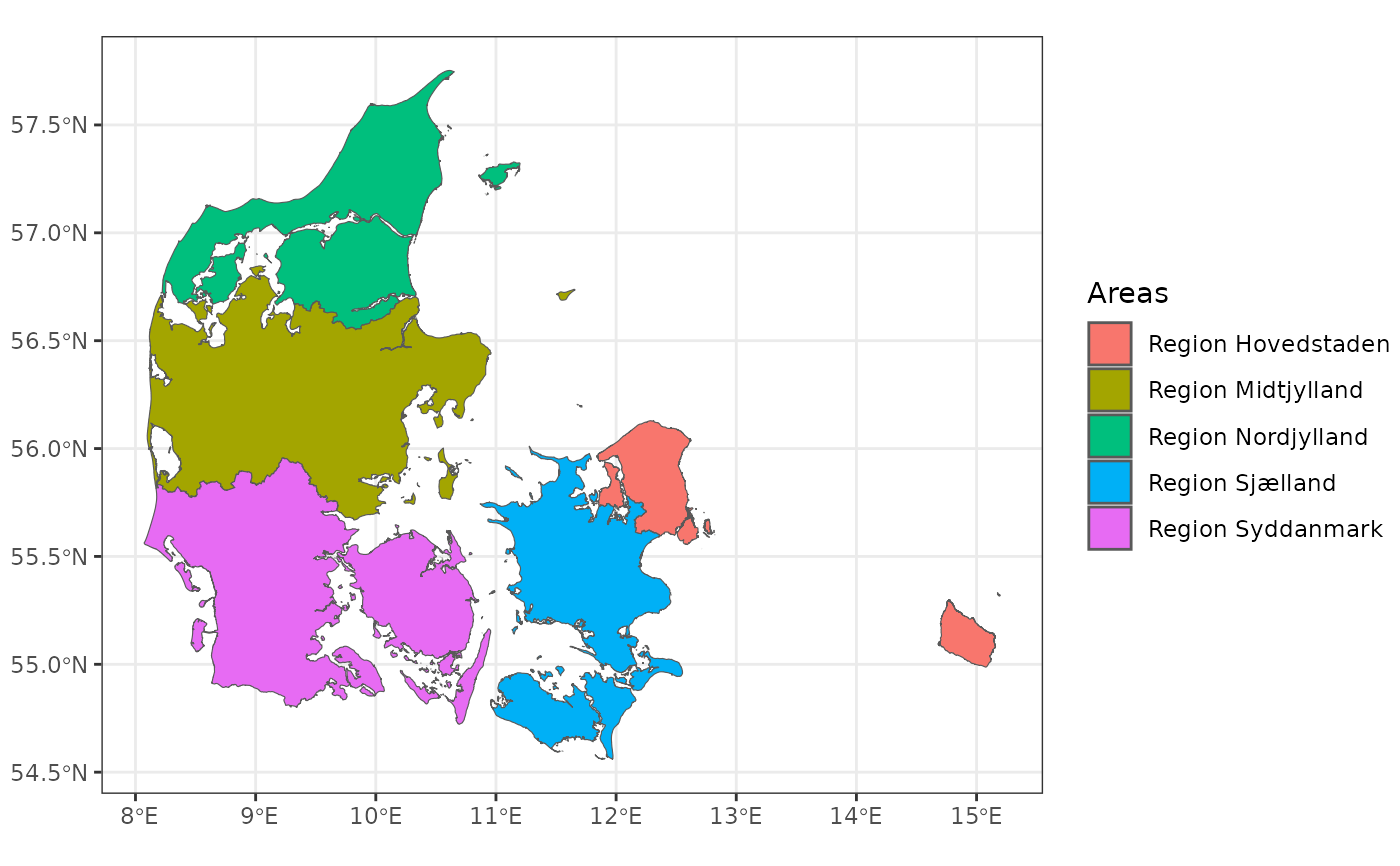
Plot a nice map of Denmark with borders at a given level. Options to fill based on area names or color borders are included. A legend guide is shown if less than 15 areas are plotted.
Arguments
- level
The desired administrative geographic level for the map. Should be one of
get_levels()- fill
The desired color for the areas to be filled with. Could be either a R-friendly color (name or hex code) or
namesto fill based on the area names.- color
The desired color for the area borders to be colored with. Could be either a R-friendly color (name or hex code) or
namesto fill based on the area names.
Value
Returns a ggplot object that can be manipulated as any other. The object is automatically printed.
Examples
plot_denmark()
#> → Getting data on `regioner`. This usually takes 10.24s.
#> Fetching data from the API. This will take some time.
#> Reading data to `st`.
#> Converting map data to `sf` object


plot_denmark(fill = "names")
#> → Using cached response.
#> Change this behaviour by setting cache = FALSE

