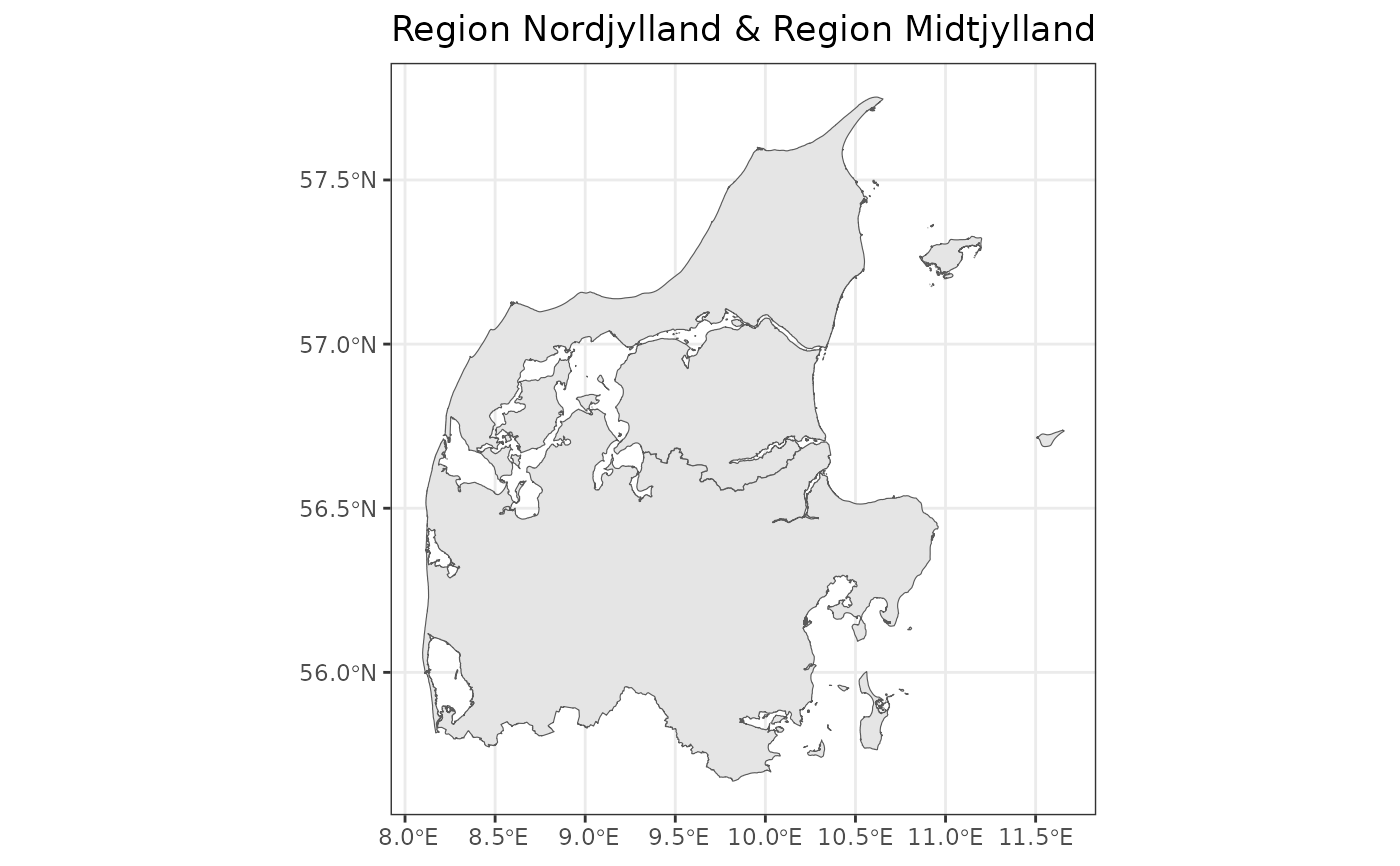
Plot a vector of regions in Denmark. Just provide the name.
Usage
plot_regions(
  region = c("Region Nordjylland", "Region Midtjylland", "Region Syddanmark",
    "Region Hovedstaden", "Region Sjælland")
)Examples
plot_regions(region = c("Region Nordjylland", "Region Midtjylland"))
#> → Using cached response.
#> Change this behaviour by setting cache = FALSE

