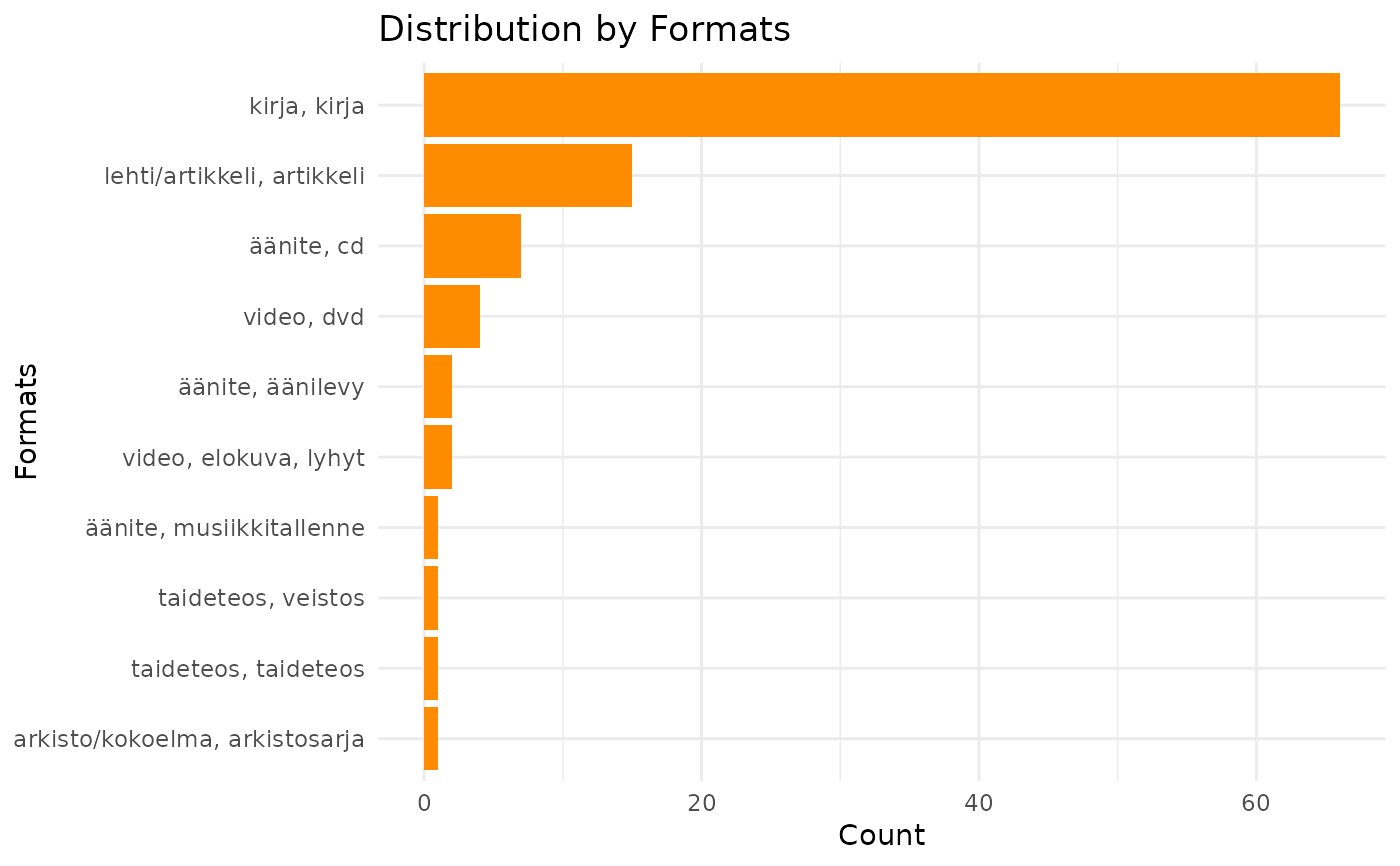
Creates a bar plot showing the distribution of records by their formats.
Examples
library(finna)
sibelius_data <- search_finna("sibelius")
refined_data <- refine_metadata(sibelius_data)
visualize_format_distribution(refined_data)
Creates a bar plot showing the distribution of records by their formats.
library(finna)
sibelius_data <- search_finna("sibelius")
refined_data <- refine_metadata(sibelius_data)
visualize_format_distribution(refined_data)