Visualize Correlation Between Formats and Libraries
Source:R/visualize_finna.R
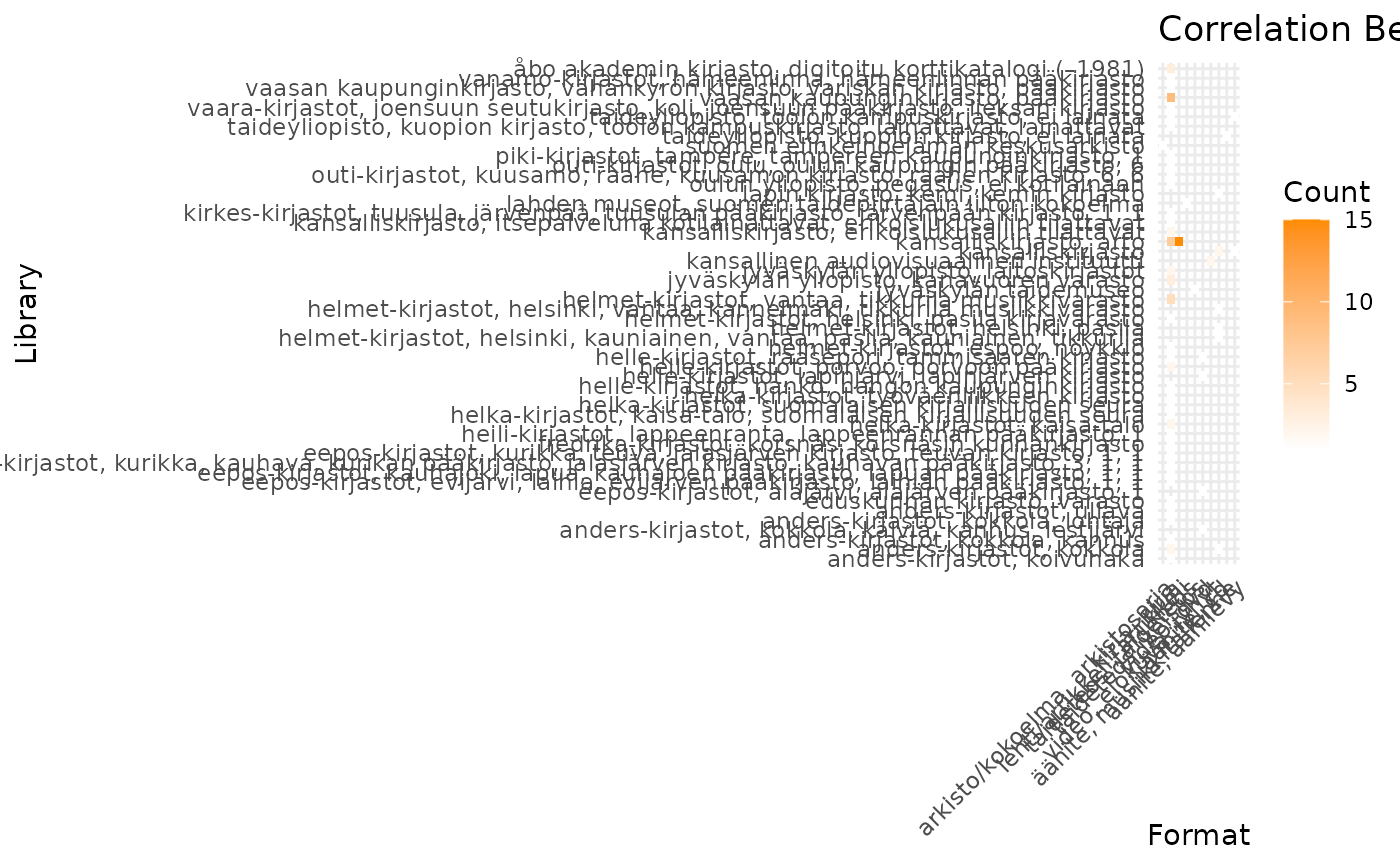
visualize_format_library_correlation.RdCreates a heatmap showing the correlation between formats and libraries.
Examples
library(finna)
sibelius_data <- search_finna("sibelius")
#> Warning: Default limit of 100 records is being used. Specify 'limit' argument for more records.
#> Total results found: 44513
#> Data fetching completed in 0.56 seconds.
refined_data <- refine_metadata(sibelius_data)
visualize_format_library_correlation(refined_data)