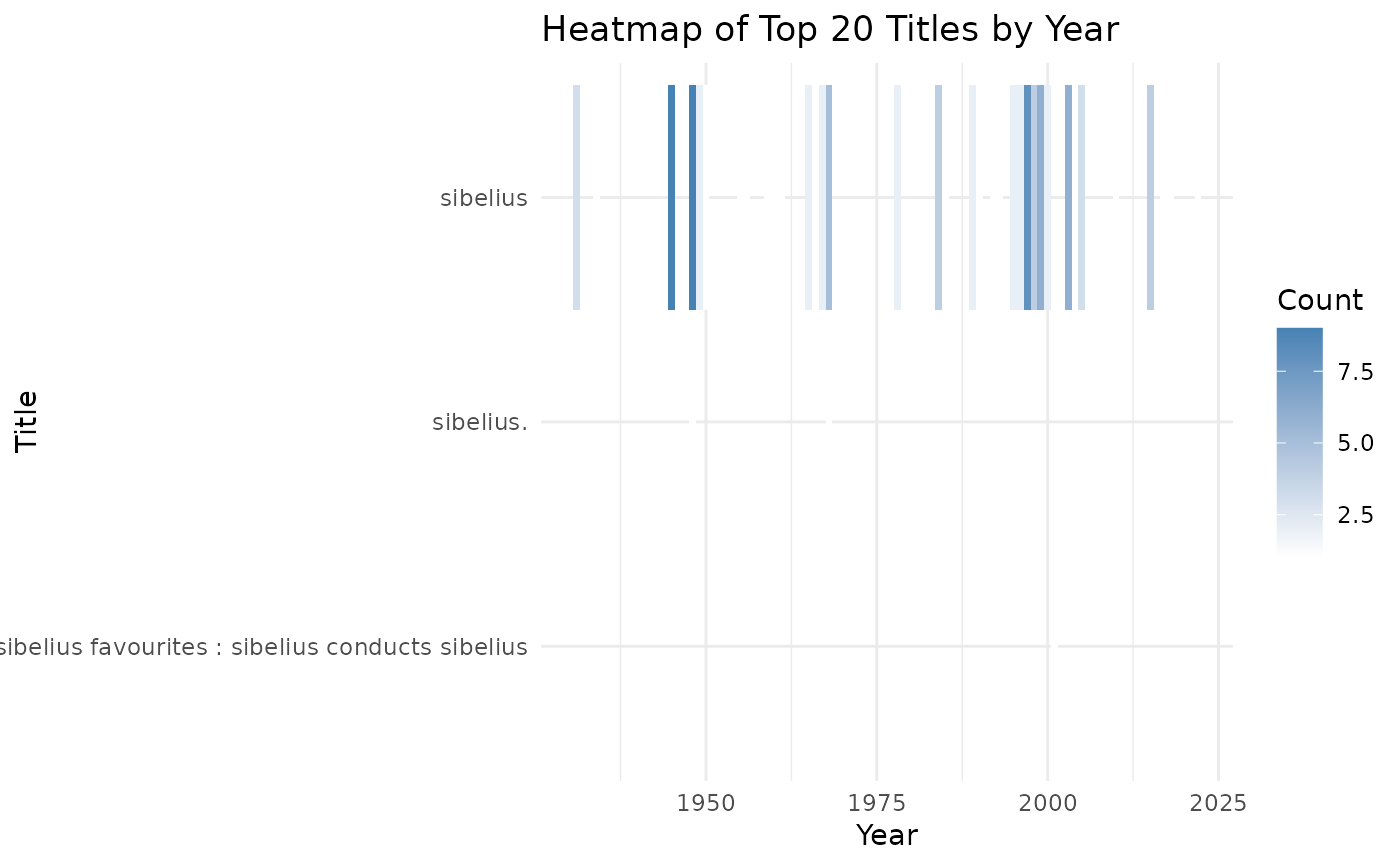
Creates a heatmap showing the most frequent titles and their occurrence over time.
Examples
library(finna)
sibelius_data <- search_finna("sibelius")
refined_data <- refine_metadata(sibelius_data)
visualize_title_year_heatmap(refined_data)
#> Warning: There was 1 warning in `mutate()`.
#> ℹ In argument: `Year = as.numeric(Year)`.
#> Caused by warning:
#> ! NAs introduced by coercion