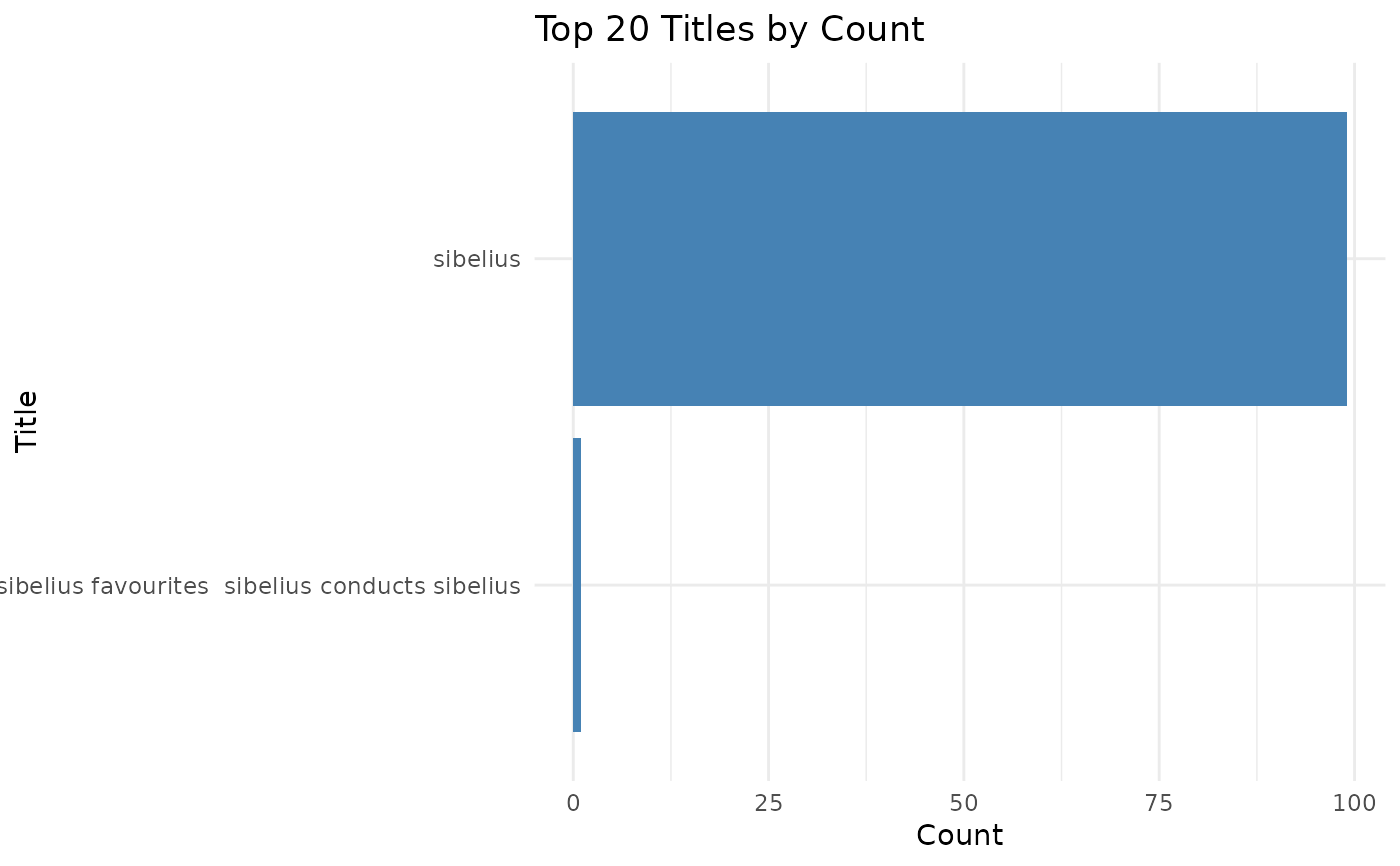
Creates a bar plot showing the top-20 most frequent titles and their counts.
Examples
library(finna)
sibelius_data <- search_finna("sibelius")
#> Warning: Default limit of 100 records is being used. Specify 'limit' argument for more records.
#> Total results found: 44513
#> Data fetching completed in 0.57 seconds.
refined_data <- refine_metadata(sibelius_data)
visualize_top_20_titles(refined_data)