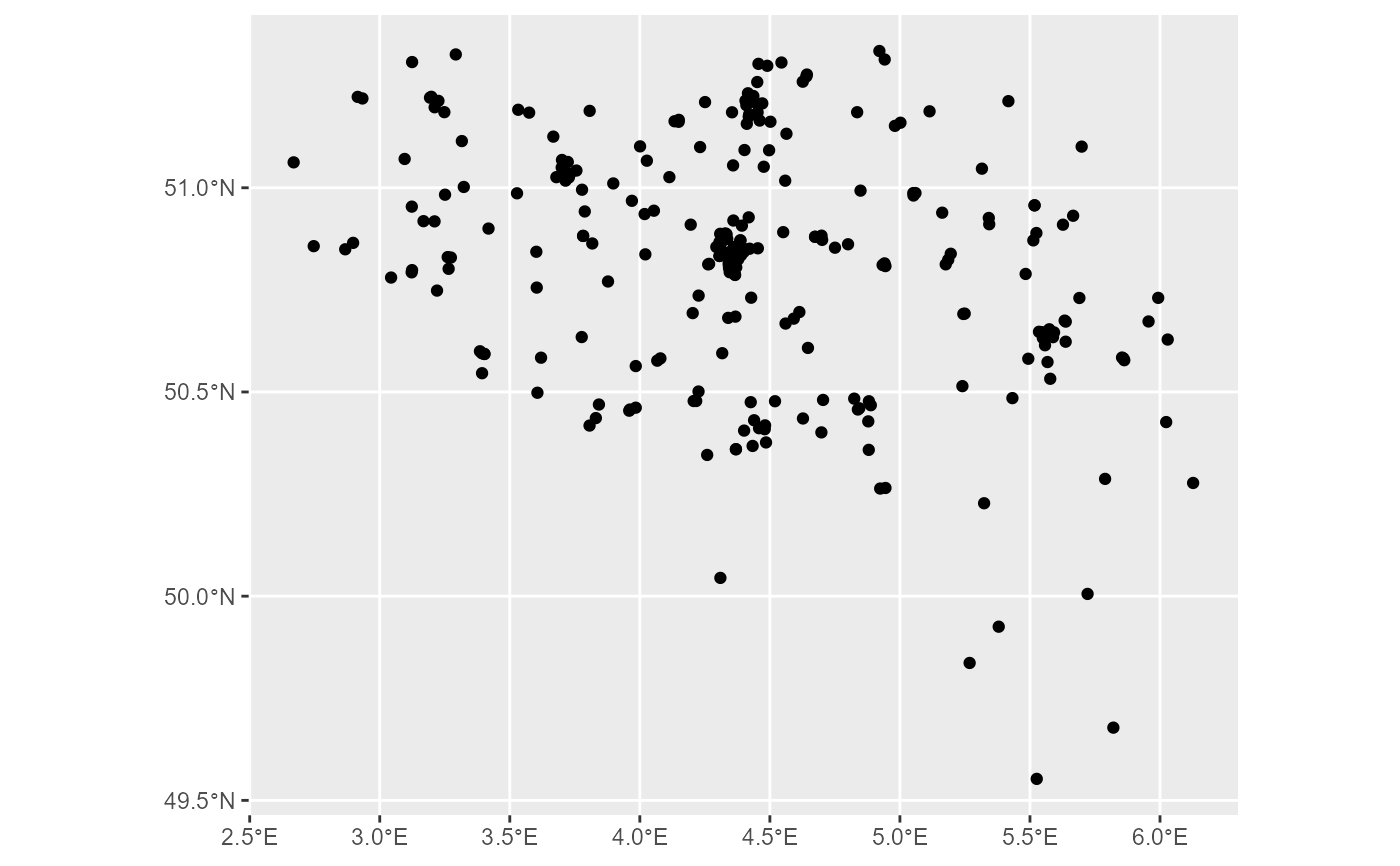
The dataset contains information on healthcare services considered hospitals by Member States. The definition varies slightly from country to country. Broadly, hospitals are licensed establishments primarily engaged in providing medical, diagnostic and treatment services, including physician, nursing and other health services to inpatients and the specialized accommodation services required by inpatients.
Usage
gisco_get_healthcare(
  year = c(2023, 2020),
  cache = TRUE,
  update_cache = FALSE,
  cache_dir = NULL,
  verbose = FALSE,
  country = NULL
)Arguments
- year
A character string or numeric value with the release year of the file. One of
2023,2020.- cache
A logical value indicating whether to cache results. Defaults to
TRUE. See the Caching strategies section ingisco_set_cache_dir().- update_cache
A logical value indicating whether to refresh the cached file. Defaults to
FALSE. When set toTRUE, it forces a new download.- cache_dir
A character string with a path to a cache directory. See the Caching strategies section in
gisco_set_cache_dir().- verbose
A logical value indicating whether to display informational messages.
- country
A character vector of country codes. It can be either a vector of country names, a vector of ISO 3166-1 alpha-3 country codes or a vector of Eurostat country codes. See also
countrycode::countrycode().
Value
An sf object.
Details
Files are distributed in EPSG:4326.
The following table describes the healthcare service attributes:
| Attribute | Description |
id | The healthcare service identifier, based on national identification codes when available. |
hospital_name | The name of the healthcare institution. |
site_name | The name of a specific site or branch of the healthcare institution. |
lat | Latitude (WGS 84). |
lon | Longitude (WGS 84). |
street | Street name. |
house_number | House number. |
postcode | Postcode. |
address | Address information when the source does not separate address components. |
city | City name. In some sources, this refers to a region or municipality. |
cntr_id | Country code (2 letters, ISO 3166-1 alpha-2). |
emergency | yes or no, indicating whether the healthcare site provides emergency medical services. |
cap_beds | Number of beds, the most common capacity measure. |
cap_prac | Number of practitioners. |
cap_rooms | Number of rooms. |
facility_type | Type of healthcare service, such as a psychiatric hospital, based on national classification. |
public_private | Public or private status of the healthcare service. |
list_specs | List of specialties recognized in the EU and EEA according to the 2005 EU Directive (Annex V). |
tel | Telephone number. |
email | Email address. |
url | URL for the institution's website. |
ref_date | The reference date (DD/MM/YYYY) for the data. |
pub_date | The publication date of the dataset by Eurostat (DD/MM/YYYY). |
geo_qual | Geolocation quality indicator: 1 = Good, 2 = Medium, 3 = Low, 4 = From source, -1 = Unknown, -2 = Not geocoded. |
comments | Additional information on the healthcare service. |
Copyright
The general Eurostat copyright and license provisions apply. Detailed metadata also list source-specific licensing conditions by country and data provider. Review the conditions for the selected data before use.
Data quality
The data are extracted from official national registers. They may contain inconsistencies, inaccuracies and gaps due to the heterogeneity of the national input data.
See also
Basic service datasets:
gisco_get_education()
Examples
health_benelux <- gisco_get_healthcare(
  country = c("BE", "NL", "LU"),
  year = 2023
)

# Plot if downloaded.
if (
  !is.null(health_benelux) &&
    requireNamespace("ggplot2", quietly = TRUE)
) {
  benelux <- gisco_get_countries(country = c("BE", "NL", "LU"))

  library(ggplot2)
  ggplot(benelux) +
    geom_sf(fill = "grey10", color = "grey20") +
    geom_sf(
      data = health_benelux, color = "red",
      size = 0.2, alpha = 0.25
    ) +
    theme_void() +
    theme(
      plot.background = element_rect(fill = "black"),
      text = element_text(color = "white"),
      panel.grid = element_blank(),
      plot.title = element_text(face = "bold", hjust = 0.5),
      plot.subtitle = element_text(face = "italic", hjust = 0.5)
    ) +
    labs(
      title = "Healthcare services", subtitle = "Benelux (2023)",
      caption = "Source: Eurostat, Healthcare 2023 dataset."
    ) +
    coord_sf(crs = 3035)
}