vignettes/menu/ggplot2.Rmd
ggplot2.Rmd
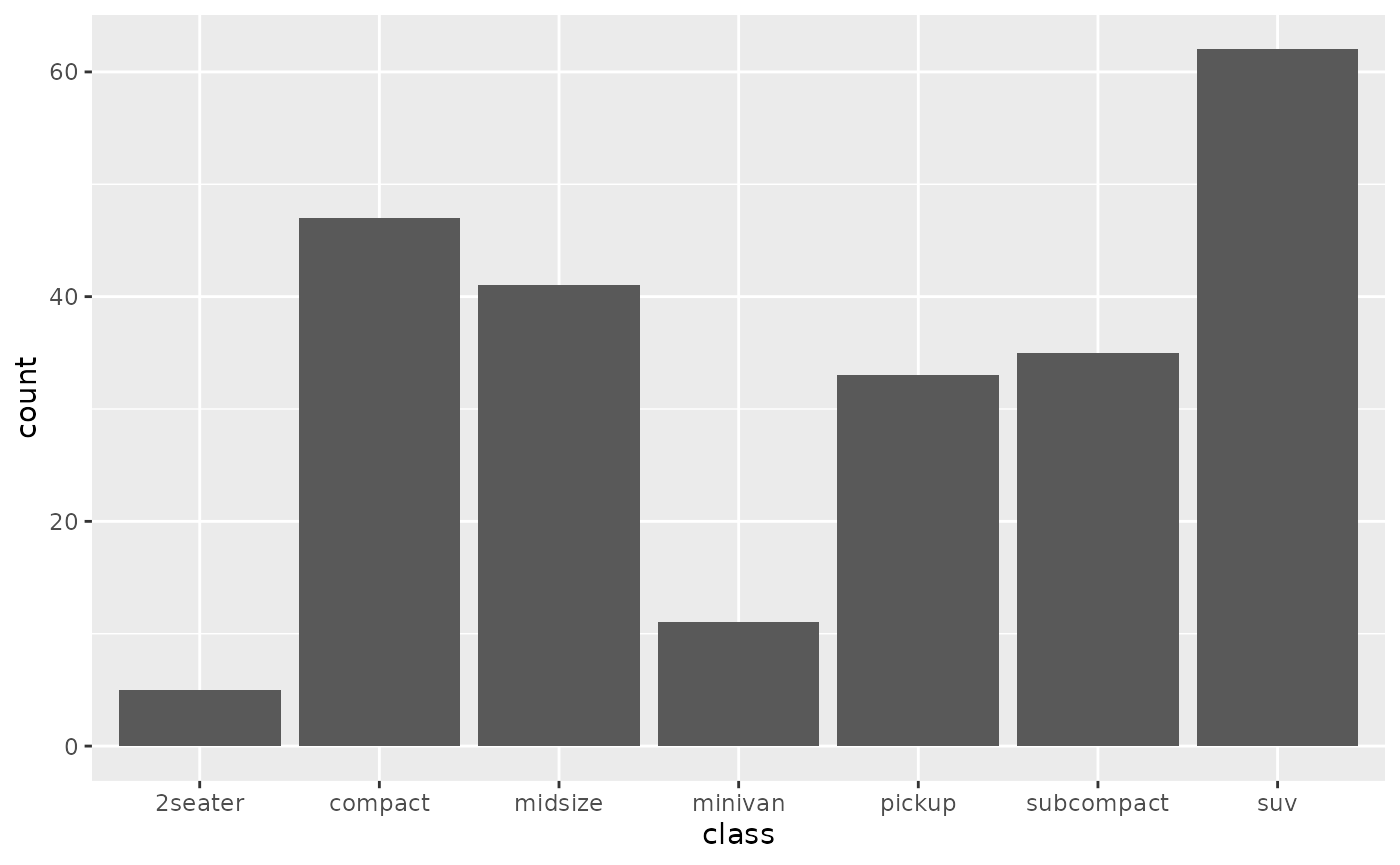
Example of a ggplot2 image.
library(ggplot2)

# Count rows or sums of weights.
g <- ggplot(mpg, aes(class))
# Number of cars in each class.
g + geom_bar()
A ggplot2 image