
flowchart LR
A[Hard edge] --> B(Round edge)
B --> C{Decision}
C --> D[Result one]
C --> E[Result two]
Citations
- Citation: Wickham (2014)
Code annotations
library(tidyverse)
library(palmerpenguins)
1penguins |>
2  mutate(
    bill_ratio = bill_depth_mm / bill_length_mm,
    bill_area  = bill_depth_mm * bill_length_mm
  )
- 1
-
Start with
penguins. - 2
- Add new columns for the bill ratio and bill area.
Code filename
matplotlib.py
import matplotlib.pyplot as plt
plt.plot([1,23,2,4])
plt.show()
Callout blocks
Note
Callout types include note, tip, warning, caution and important.
Warning
Callouts provide a simple way to draw attention to content, such as this warning.
Important
The callout type provides the expected heading, such as Note, Warning, Important, Tip or Caution.
Tip with title
This is an example of a callout with a title. Providing a callout heading is optional.
Caution
This is an example of a caution.
Simple
A simple callout.
Diagrams
HTML widgets
Keyboard
- Keyboard shortcut: Shift-Ctrl-PShift-Ctrl-P
Lists
-
Item 2
Continued (indent 4 spaces)
Another example.
Ordered list
-
Item 2
print("Hello, World!")- Sub-sub-item 1
A task list.
A definition.
- Term
-
Definition
Footnotes
Here is a footnote reference1 and another.2
This paragraph is not part of the footnote because it is not indented.
Here is an inline note.3
Equations
Inline math: E = mc^{2}.
Display math:
E = mc^{2}
Other blocks
Line Block
Spaces and newlines
are preserved
Spaces and newlines
are preserved
This text is smallcaps
This text is underlined
This text is highlighted
En dash: –
Em dash: —
Shortcodes
The subtitle of this document is as follows: Using this for shortcodes

Lorem ipsum dolor sit amet, consectetur adipiscing elit. Duis sagittis posuere ligula sit amet lacinia. Duis dignissim pellentesque magna, rhoncus congue sapien finibus mollis. Ut eu sem laoreet, vehicula ipsum in, convallis erat. Vestibulum magna sem, blandit pulvinar augue sit amet, auctor malesuada sapien. Nullam faucibus leo eget eros hendrerit, non laoreet ipsum lacinia. Curabitur cursus diam elit, non tempus ante volutpat a. Quisque hendrerit blandit purus non fringilla. Integer sit amet elit viverra ante dapibus semper. Vestibulum viverra rutrum enim, at luctus enim posuere eu. Orci varius natoque penatibus et magnis dis parturient montes, nascetur ridiculus mus.
A section
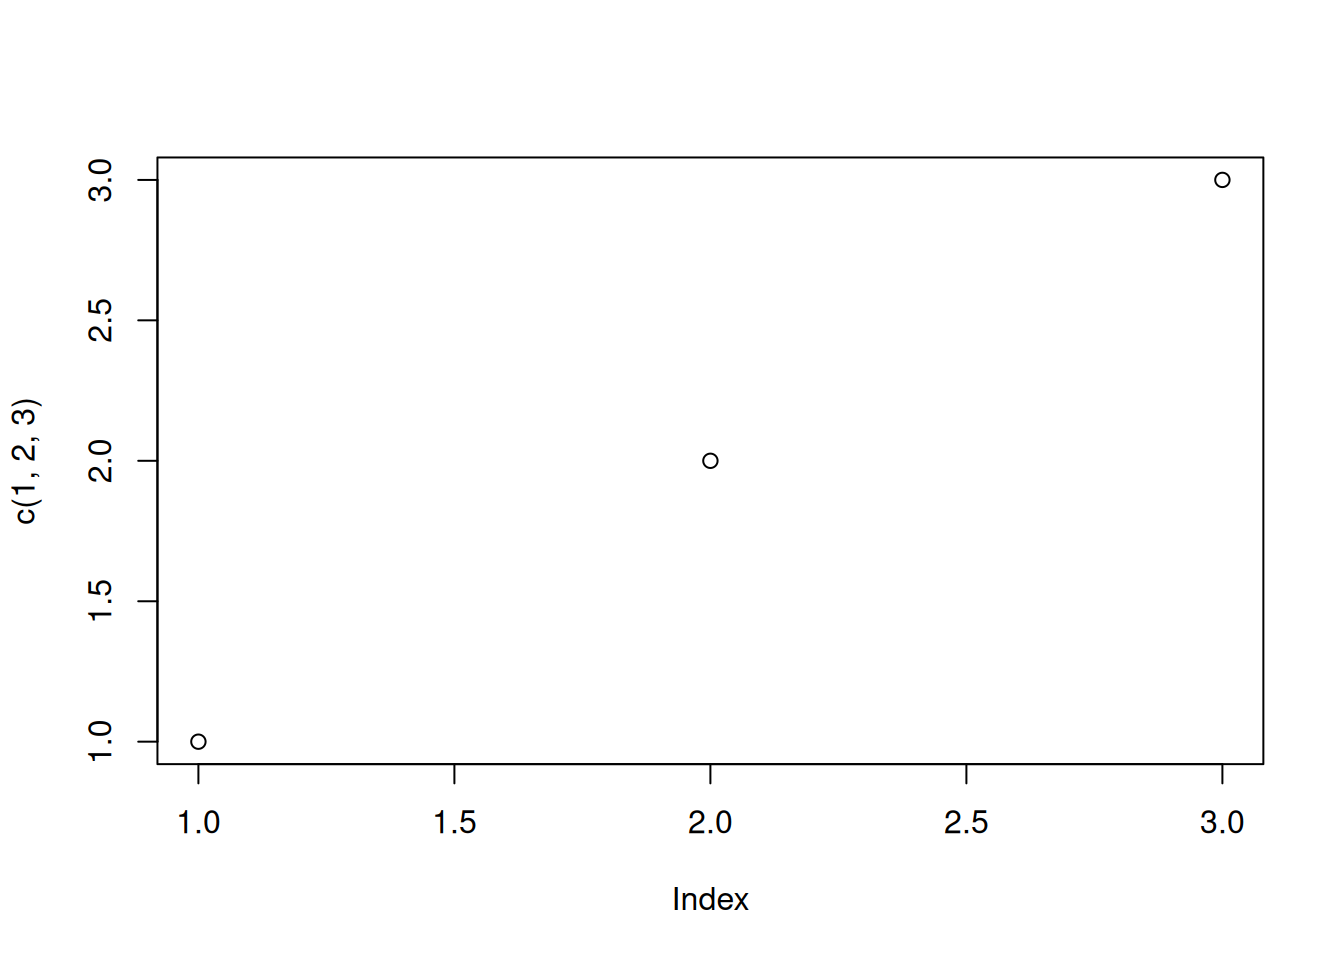
Here we define a plot.
Note the following plot
Another example
We will define some values here.
The output of that inline code cell is some code.
Figures



Video
See Figure 2.
References
Wickham, Hadley. 2014. “Tidy Data.” Journal of Statistical Software, Articles 59 (10): 1–23. https://doi.org/10.18637/jss.v059.i10.